Device View
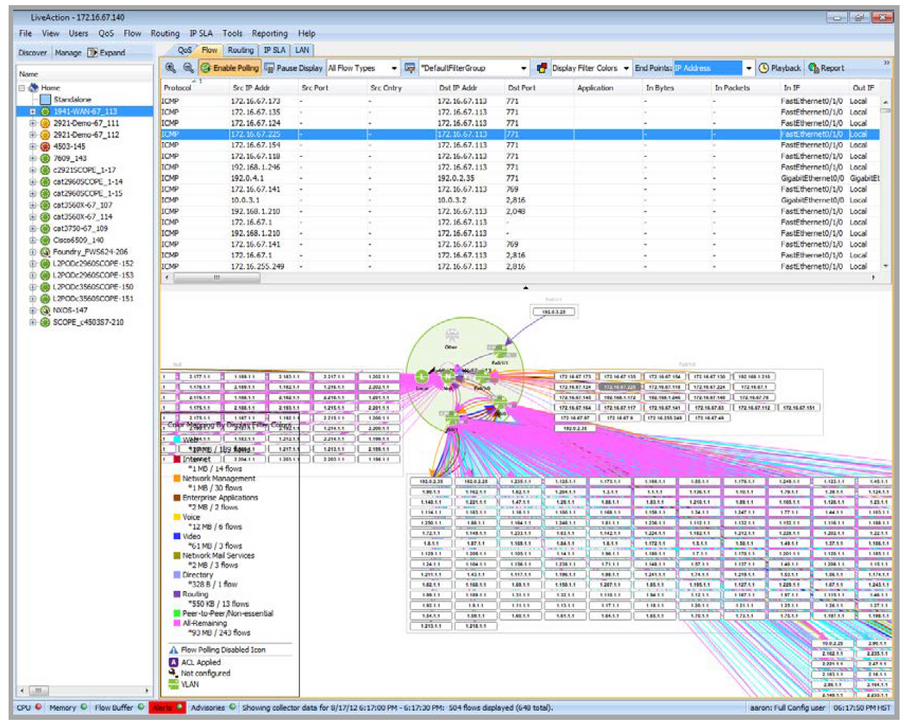
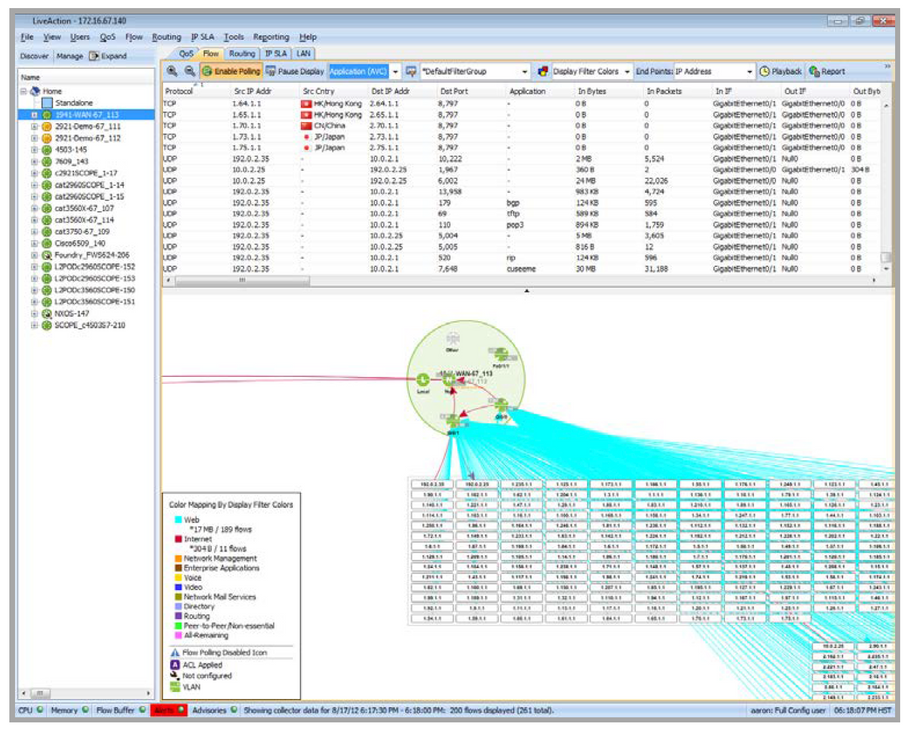
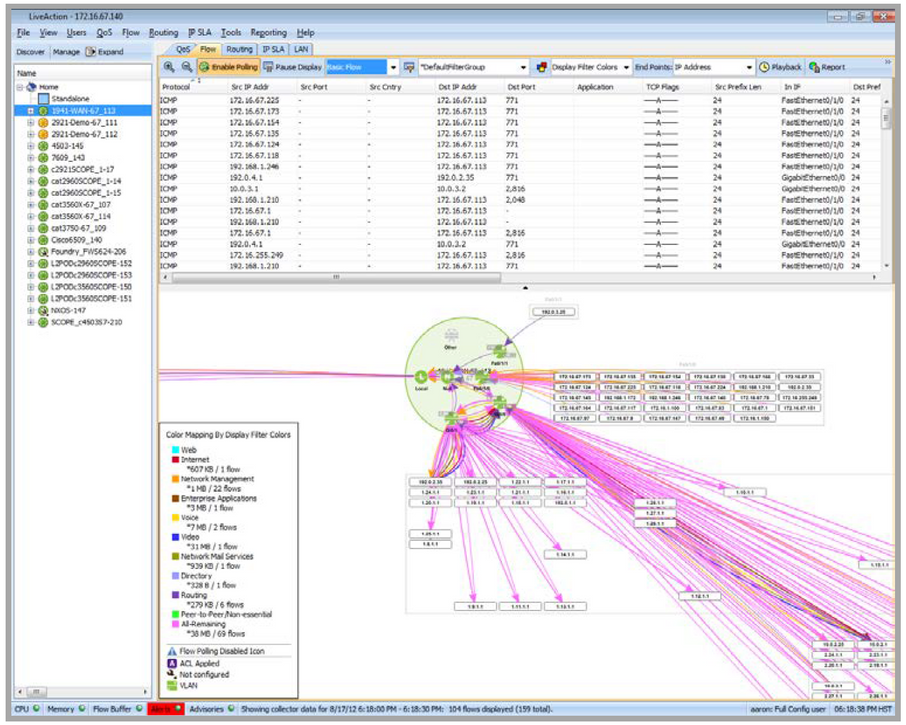
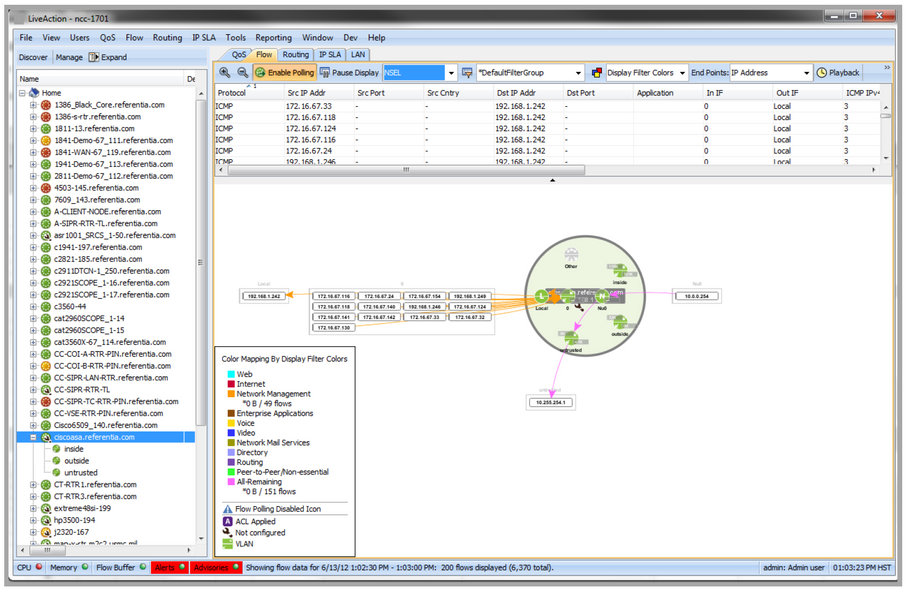
The device flow view provides a topology and table view of the traffic flowing through the device. The device view automatically refreshes the flows displayed in the table and topology based on the configured polling rate. The controls of the device flow visualization are located on the tool bar of the Flow Tab.
• Enable Polling (button): enables and disable the collection of flow data from the device.
• Pause Display (button): pauses the automated refresh on the current interval. While the device view is paused you may change the various selectors to change what is visualized for the current interval.
• Selectors that change the flows retrieved and how they are visualized:
• Flow Technology Type Selector: this provides a mechanism to restrict the types of flows that are retrieved. All Flow Types will retrieve all types. Selecting any of the following will restrict the retrieval to just the selected type: Application (AVC), Basic Flow, Medianet, NSEL, PfR, and Unknown. For Basic Flow and Medianet, the flows are the top 200 by byte count for the given time period. For AVC, PfR, and NSEL, the flows are the last 200 flows in that given time period.
• Filter Selector: provides the ability to filter the flows retrieved during the refresh.
• Color Mapping Selector: provides the ability to color match the flows retrieved during the refresh by a certain algorithm.
• End Point Selector provides the ability to change how the flows are drawn on the topology.
• A Color Mapping legend is overlaid on the topology to indicate flow coloring and the number of bytes and flows that match each of the color mappings. The legend can be toggled on and off by opening the View menu and selecting Show Legends.
• Flows can be drawn on the topology as merged or unmerged. This can be changed by going to the Flow menu and selecting Show Merged Flows. • Mousing over a flow provides bit rate, total bytes, and source and destination information.
• The highlighting of the flows is linked to the table and the topology.
Interfaces labeled Local in this graph indicate flows to and from the router itself. Interfaces labeled Null indicate flows that are dropped or are multicast or broadcast in the nature that the router received them. The App Name field in the Table View combines Application and NBAR Application data. When both are present, NBAR Application takes precedence. App Names followed by a (number: number) designate NBAR applications.
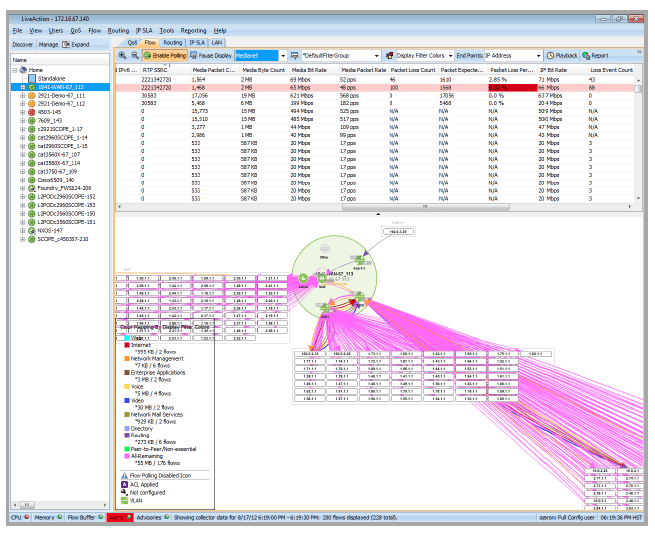
The Image Below shows a device-level view with Medianet flows highlighted in light red. This indicates that the particular Medianet flow is under alert. Scroll horizontally along the table until there is a dark red cell, indicating the particular attribute that exceeded the alert threshold. For details on the Medianet threshold values, or any threshold alert, please see Tools.
The Image Below shows a device-level view with Medianet flows highlighted in light red. This indicates that the Medianet flow is under alert. Scroll horizontally along the table until there is a dark red cell, indicating the attribute that exceeded the alert threshold. For details on the Medianet threshold values, or any threshold alert, please see Tools.